Now that Google+ is growing by leaps and bounds, power users are focusing on methods to leverage this platform to the maximum. For specialists, devising a powerful social media strategy that primarily focuses on engagement and networking is not that hard. What’s even more important is formulating a method to correctly asses the return-on-investment (ROI) at both macro and micro level. This method may differ depending on the platform and requires accurate as well as timely data collection. So, are you planning to invest your time on Google+?
If so, have you devised an effective methodology to measure your reach and visibility? Engagement level and sentiment analysis are two primary attributes that are closely associated with the measurement of reach and visibility. So let’s get started and see two very important Google+ metrics that helps you in analyzing how well you’re engaging with people on this excellent social media platform.
Posts’ Amplification (Visibility)
A basic criterion for measuring your reach on any social network is the extent to which your content (post updates, shared links and uploaded multimedia content) is shared within and beyond your existing network. It can be compared with a pebble creating ripples in the pond. Whenever you post an update on Google+, your friends or your Google+ page followers can share it in three simple ways.- Public sharing – This is pretty simple. Shares visible to anyone on the web are public in nature. Their visibility is not just limited to Google+, but is actively indexed by search engines as well. This essentially means that all these public shares may appear in SERPs as well.
- Limited sharing – If you’re sharing a piece of content with a group of individuals or selective circles, its scope is ‘Limited’. Such updates are not visible to search engines.
- Private sharing – You can compare it with email messaging. In such cases, you’re sharing the content with a single individual within or beyond your network. If a user has enabled direct messaging in his profile, regardless of whether he is in your network or not, you can still share content privately with him.

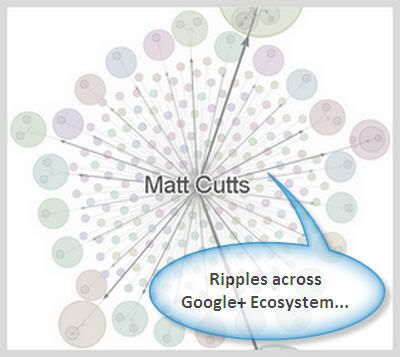
The second way to know about the reshares is the graphical representation of ripples across the Google+ ecosystem as shown in the image above. You can access this interactive graphic by selecting the ‘View Ripples’ option from within the post. Remember, this graphic doesn’t show private and old reshares. We can well understand the exclusion of private reshares. If they are reflected in this interactive graphic, the whole purpose of sharing a piece of content privately is defeated. Old reshares are possibly excluded to reduce the complexity of the graphic, especially in cases where a post becomes viral and is shared consistently for a long period of time. Ripples visualization only shows last 53 days data.

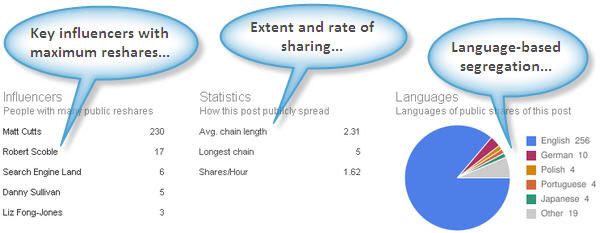
- Key influencers – This data tells you about the top 5 users with wider reach and authority triggering large number of reshares. Do not confuse these users with top leaders in their domain, because it simply picks the top 5 users with maximum reshares. They can either be big names in their domain or simply your peers having active friends list.
- Rate and extent of sharing – This one is my favorite and is extremely useful for those posts that really go viral. You can find out three important trends through this data. Shares/Hour gives you an average of reshares per hour for last 53 days. This trend may deviate sharply in the first 24 hours and may decline in a liner fashion as time passes by. Average chain length depicts the longest reshares done in a linear fashion where each subsequent reshare falls in an extended circle. Longest chain simply tells the longest ripple across extended circles.
- Language-based segregation – Knowing about this trend is very useful for Google+ business pages targeting multilingual followers. You get a nice pie chart showing each section of users divided on the basis of their language.
Annotated References (Search Impact)
Tagging is one of the most common activities on almost every popular social media network. Although an annotated reference is automatically included in every reshare on Google+, it doesn’t truly reflect the engagement level since the tagging is implicit in nature. What we’re really looking for is explicit tagging activity triggering direct engagement with us.

No comments:
Post a Comment